The phenomenon predates the Kirlian name
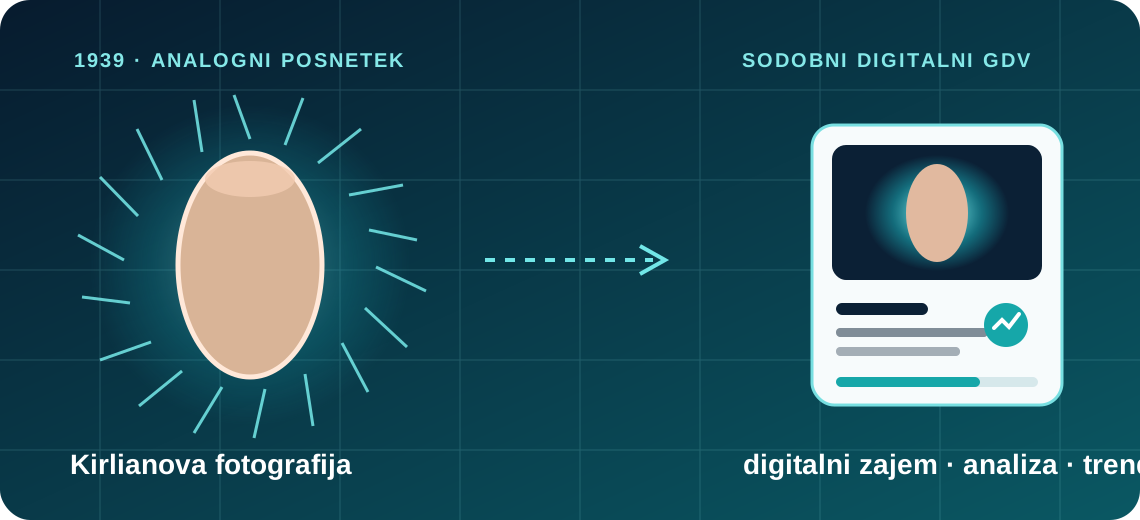
Experiments with electrical discharges and photographic plates were already being performed in the late nineteenth century. In 1939, while working with high-frequency medical equipment, Semyon Kirlian observed that an object placed on a photographic plate in an electric field could create a luminous outline. Together with Valentina Kirlian, he spent decades developing the method and equipment. Their name became the common label for contact photography of corona discharges.
The historical importance of the Kirlian method is not the discovery of an invisible “energy body”, but its ability to make the optical effects of electrical discharge visible and repeatable. Because of their unusual appearance, the images quickly attracted symbolic and spiritual interpretations, which need to be separated from the physical mechanism that creates the image.
Putting the idea into practice
The greatest value comes from turning an idea into a small, testable process. Define the goal and baseline first, change only what can be observed, and record the result. In technical work this means measurements, logs and repeatable tests; in personal practices it means a clear intention, a time frame, and separating subjective impressions from measurable change.
It is equally important to distinguish possibility from evidence. An interesting hypothesis can justify exploration, but it is not yet an established fact. PICALLW therefore favours transparency where technology, human experience and less-established approaches meet: what is well supported by research, what is practical experience, and what should still be treated as experimental.
What happens between the object and electrode?
In a classical setup, an object or fingertip is placed near an electrode, separated by an insulating layer, photographic material or glass surface. Brief high-voltage pulses create a strong local electric field. Molecules in the surrounding gas are partially ionised, producing electrons and ions; collisions release photons. A camera or photographic film records the light from these small discharge channels.
This is not passive photography of light spontaneously emitted by the body. The measuring system actively excites a discharge. The result reflects an interaction among voltage, electrode geometry, dielectric material, air, the object surface and the nature of contact.
Why is moisture so important?
One of the best-known experimental findings is that moisture strongly modulates corona photographs. A study by Pehek, Kyler and Faust in Science showed orderly image changes at different moisture levels and suggested that corona discharge photography could detect and quantify moisture. A broader or brighter glow is therefore not, by itself, evidence of greater “life energy”.
For fingertips, perspiration, skin oils, washing, creams, skin temperature, rest time and a microscopic moisture film on the glass all matter. Finger pressure and angle also influence the image because larger or uneven contact changes the electric field and discharge geometry.
Other factors that can change the image
- Device settings: pulse amplitude, duration, frequency and number of pulses.
- Geometry: distance from the electrode, glass thickness and finger position.
- Environment: relative humidity, temperature, pressure and electromagnetic interference.
- Participant preparation: physical activity, contact with water, cosmetics, and time since the last meal or stimulant.
- Image processing: brightness threshold, noise removal, calibration and segmentation.
A high-quality protocol is therefore more important than the visual impression of a single image. Longitudinal measurements should be made at a similar time, under similar conditions, after a brief rest, and with the same settings and calibration.
Classical Kirlian photography, digital GDV and Bio-Well
Bio-Well is a commercial system based on Gas Discharge Visualization, also called electrophotonic imaging. Its official description emphasises rapid, non-invasive fingertip capture and computer processing. Manufacturer claims should be considered separately from independent clinical validation. A 2023 literature review found potentially interesting applications but concluded that methodologically stronger studies are needed before definitive conclusions can be drawn.
What does software actually calculate from the image?
The raw capture is a matrix of luminous pixels. After background and noise removal, algorithms can calculate luminous area, contour length, mean and local intensity, irregularity, fractal or entropy-related features, radial distribution and sector-based values. Ten fingertip captures can then be combined into left-right comparisons, time trends and visualisations.
A calculated parameter is not the same thing as biological meaning. When software reports “energy” or “stress”, the value is produced by a model and calibration; it is not a direct measurement of energy in a physical unit or a medical diagnosis. Professional use requires transparency about formulas, reference ranges and repeatability.
What does research support, and what remains uncertain?
The physical existence of corona discharge and the influence of measurement conditions, especially moisture, are well established. Some studies examine associations between GDV parameters, physiological states and responses to interventions. However, the literature is heterogeneous, with different devices, small samples, different algorithms and frequent absence of blinding or independent replication.
The most honest conclusion is twofold. Digital GDV is a real measurement technology for capturing and quantifying gas-discharge patterns. Broader interpretations involving organs, chakras, diseases or a “biofield”, however, do not yet have the same level of scientific validation as standard medical measurements.
The “phantom leaf” claim
A famous claim holds that a complete leaf outline remains visible after part of the leaf has been removed. Later experiments showed that residual moisture, plate contamination, multiple exposure or preparation methods can create similar effects. Published replications have not produced simple, unambiguous evidence of a separate biological field. The case demonstrates why equipment cleaning, controls and blinded procedures matter.
How to read a GDV result responsibly
- First inspect raw-image quality and possible artefacts.
- Assess whether capture conditions were comparable and calibration valid.
- Interpret numerical parameters together rather than relying on one “magic” value.
- Give more weight to a repeatable trend than to one measurement.
- Clearly separate interpretation from medical diagnosis.
GDV can be an interesting research and biofeedback tool when users understand what the device measures, how the signal is created and where interpretation begins. Its greatest value lies in consistent protocols, comparisons and transparent analysis.
Where does GDV Studio fit?
GDV Studio is being developed as a local environment for direct Bio-Well 2.0 capture, opening original BDF files, quality checking, calibration, visualisation, comparison and professional reporting. Its purpose is not to turn a corona image into a medical diagnosis, but to support a clearer, more repeatable and documented workflow.
Special emphasis is placed on local data storage, visibility of raw and calculated results, longitudinal tracking and the development of algorithms that can be compared with reference data.
Sources and further reading
- Pehek, Kyler in Faust: Image modulation in corona discharge photography, Science (1976)
- Gas Discharge Visualization: An Imaging and Modeling Tool
- Applications of GDV Imaging in Health and Disease: systematic review
- The phantom leaf effect: a replication
- Official Bio-Well description